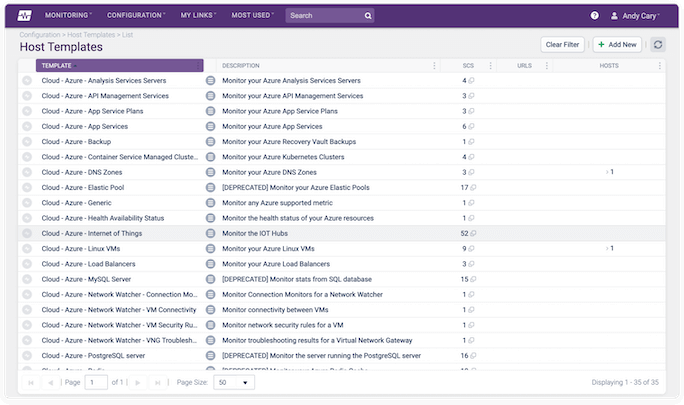
Cloud - Azure - Analysis Services Servers
add_circleService Check Name | Description | Default Thresholds (Warning, Critical) | UOM |
---|---|---|---|
Azure - Analysis Services Server - QPU | The average number of query processing units [Default Timespan = 5mins, Granularity = 5mins] | N/A | N/A |
Azure - Analysis Services Server - Memory | Average memory status, in bytes [Default Timespan = 5mins, Granularity = 5mins] | N/A | B |
Azure - Analysis Services Server - Connections | Average number of connection requests by status [Default Timespan = 5mins, Granularity = 5mins] | N/A | N/A |
Azure - Analysis Services Server - Sessions | Current number of user sessions established [Default Timespan = 5mins, Granularity = 5mins] | N/A | N/A |
Cloud - Azure - API Management Services
add_circleService Check Name | Description | Default Thresholds (Warning, Critical) | UOM |
---|---|---|---|
Azure - API Management Service - Requests | Total number of requests by status [Default Timespan = 5mins, Granularity = 5mins] | N/A | N/A |
Azure - API Management Service - Duration | Overall Duration of Gateway Requests in milliseconds [Default Timespan = 5mins, Granularity = 5mins] | N/A | ms |
Azure - API Management Service - Capacity | Utilization metric for ApiManagement service, in percent [Default Timespan = 5mins, Granularity = 5mins] | capacity=70,90 | % |
Cloud - Azure - App Service Plans
add_circleService Check Name | Description | Default Thresholds (Warning, Critical) | UOM |
---|---|---|---|
Azure - App Service Plan - Percentages | CPU/Memory Percentage [Default Timespan = 5mins, Granularity = 5mins] | cpu_percentage=70,90 memory_percentage=70,90 |
% |
Azure - App Service Plan - Queue Length | Disk/Http Queue Length [Default Timespan = 5mins, Granularity = 5mins] | N/A | N/A |
Azure - App Service Plan - Bytes | Data in/Data out, in bytes [Default Timespan = 5mins, Granularity = 5mins] | N/A | B |
Cloud - Azure - App Services
add_circleService Check Name | Description | Default Thresholds (Warning, Critical) | UOM |
---|---|---|---|
Azure - App Service - CPU Time | CPU Time, in seconds [Default Timespan = 5mins, Granularity = 5mins] | N/A | s |
Azure - App Service - Threads | Thread Count [Default Timespan = 5mins, Granularity = 5mins] | N/A | N/A |
Azure - App Service - Memory | Memory working set [Default Timespan = 5mins, Granularity = 5mins] | N/A | B |
Azure - App Service - Bytes | Data in/Data out, in bytes [Default Timespan = 5mins, Granularity = 5mins] | N/A | B |
Azure - App Service - Requests | Total number of requests [Default Timespan = 5mins, Granularity = 5mins] | N/A | N/A |
Azure - App Service - Response Time | Average Response Time [Default Timespan = 5mins, Granularity = 5mins] | N/A | s |
Cloud - Azure - Backup
add_circleService Check Name | Description | Default Thresholds (Warning, Critical) | UOM |
---|---|---|---|
Azure - Backup and Site Recovery - Backup Jobs | The number and status of backup jobs and information on the erroneous ones [Default Timespan = 5mins, Granularity = 5mins] | N/A | NA |
Cloud - Azure - Container Service Managed Clusters
add_circleService Check Name | Description | Default Thresholds (Warning, Critical) | UOM |
---|---|---|---|
Azure - Kube Node - Allocatable CPU Cores | Total number of available cpu cores in a managed cluster [Default Timespan = 5mins, Granularity = 5mins] | N/A | N/A |
Azure - Kube Node - Allocatable Memory | Total amount of available memory in a managed cluster [Default Timespan = 5mins, Granularity = 5mins] | N/A | B |
Azure - Kube Node - Status Condition | Statuses for various node conditions [Default Timespan = 5mins, Granularity = 5mins] | N/A | N/A |
Azure - Kube - Pods Ready | Number of pods in Ready state [Default Timespan = 5mins, Granularity = 5mins] | N/A | N/A |
Cloud - Azure - DNS Zones
add_circleService Check Name | Description | Default Thresholds (Warning, Critical) | UOM |
---|---|---|---|
Azure - DNS Zone - Query Volume | Total number of Bytes transmitted within time period [Default Timespan = 240mins, Granularity = 60mins] | N/A | N/A |
Azure - DNS Zone - Record Set Count | Number of Record Sets in a DNS zone [Default Timespan = 240mins, Granularity = 60mins] | N/A | N/A |
Azure - DNS Zone - Record Set Capacity | Percent of Record Set capacity utilized by a DNS zone [Default Timespan = 240mins, Granularity = 60mins] | record_set_capacity_utilization=70,90 | % |
Cloud - Azure - Elastic Pool
add_circleService Check Name | Description | Default Thresholds (Warning, Critical) | UOM |
---|---|---|---|
Azure - EP - Allocated Storage | The allocated data storage [Default Timespan = 5mins, Granularity = 5mins] | N/A | B |
Azure - EP - Allocated Storage Percent | The percentage of storage allocated [Default Timespan = 5mins, Granularity = 5mins] | allocated_data_storage_percent=70,90 | % |
Azure - EP - CPU Usage | The percentage of CPU being used [Default Timespan = 5mins, Granularity = 5mins] | cpu_percent=70,90 | % |
Azure - EP - CPU Used | The CPU limit and number of CPUs used for the elastic pool [Default Timespan = 5mins, Granularity = 5mins] | N/A | N/A |
Azure - EP - Data IO Percent | The data IO percentage [Default Timespan = 5mins, Granularity = 5mins] | physical_data_read_percent=70,90 | % |
Azure - EP - eDTU Usage Percent | The eDTU percentage used for the elastic pool [Default Timespan = 5mins, Granularity = 5mins] | edtu_usage_percent=70,90 | % |
Azure - EP - eDTU Used | The eDTU limit and eDTU used for the elastic pool [Default Timespan = 5mins, Granularity = 5mins] | N/A | N/A |
Azure - EP - Log IO Percent | The log IO percentage [Default Timespan = 5mins, Granularity = 5mins] | log_write_percent=70,90 | % |
Azure - EP - Process CPU Usage | CPU usage of the SQL DB process as a percentage [Default Timespan = 5mins, Granularity = 5mins] | sqlserver_process_core_percent=70,90 | % |
Azure - EP - Process Memory Usage | Memory usage of the SQL DB process as a percentage [Default Timespan = 5mins, Granularity = 5mins] | sqlserver_process_memory_percent=70,90 | % |
Azure - EP - Sessions Percent | The percentage of sessions used [Default Timespan = 5mins, Granularity = 5mins] | sessions_percent=70,90 | % |
Azure - EP - Storage Usage | The percentage of storage used [Default Timespan = 5mins, Granularity = 5mins] | storage_percent=70,90 | % |
Azure - EP - Storage Used | The amount of data space used [Default Timespan = 5mins, Granularity = 5mins] | N/A | B |
Azure - EP - Tempdb Percent | The Tempdb log used percentage [Default Timespan = 5mins, Granularity = 5mins] | tempdb_log_used_percent=70,90 | % |
Azure - EP - Tempdb Used | The Tempdb data size and log size [Default Timespan = 5mins, Granularity = 5mins] | N/A | B |
Azure - EP - Workers Percent | The percentage of workers [Default Timespan = 5mins, Granularity = 5mins] | workers_percent=70,90 | % |
Azure - EP - XTP Storage Percent | The percentage of XTP (in-memory OLTP) storage used [Default Timespan = 5mins, Granularity = 5mins] | xtp_storage_percent=70,90 | % |
Cloud - Azure - Health Availability Status
add_circleService Check Name | Description | Default Thresholds (Warning, Critical) | UOM |
---|---|---|---|
Azure - Health Availability Status | The health status of all Azure resources in a given resource group [Default Timespan = 5mins, Granularity = 5mins] | N/A | NA |
Cloud - Azure - Linux VMs
add_circleService Check Name | Description | Default Thresholds (Warning, Critical) | UOM |
---|---|---|---|
Azure - Linux VM - Memory | The percentage of used memory and the available memory in bytes [Default Timespan = 5mins, Granularity = 5mins] | N/A | NA |
Azure - Linux VM - Memory Swap Space | The percentage of swap space used [Default Timespan = 5mins, Granularity = 5mins] | N/A | NA |
Azure - Linux VM - Processor Time | The percentage of processor time [Default Timespan = 5mins, Granularity = 5mins] | N/A | NA |
Azure - Linux VM - Processor Privileged Time | The percentage of processor privileged time [Default Timespan = 5mins, Granularity = 5mins] | N/A | NA |
Azure - Linux VM - Logical Disk Space | The percentage of used logical disk space [Default Timespan = 5mins, Granularity = 5mins] | N/A | NA |
Azure - Linux VM - System Uptime | The system uptime [Default Timespan = 5mins, Granularity = 5mins] | N/A | NA |
Azure - Linux VM - Heartbeat | The time between the last two heartbeats [Default Timespan = 5mins, Granularity = 5mins] | N/A | NA |
Azure - Linux VM - Restarts | The number of restarts, and information on the user and command invoke history [Default Timespan = 1440mins, Granularity = 1440mins] | N/A | NA |
Azure - Linux VM - Shutdowns | The number of shutdowns, and information on the user and command invoke history [Default Timespan = 1440mins, Granularity = 1440mins] | N/A | NA |
Cloud - Azure - Load Balancers
add_circleService Check Name | Description | Default Thresholds (Warning, Critical) | UOM |
---|---|---|---|
Azure - LB - Endpoint Availability | Availability of VIP (Virtual IP) and DIP (Dynamic IP) endpoints, based on probe results [Default Timespan = 5mins, Granularity = 5mins] | N/A | N/A |
Azure - LB - Packets Transmitted | Total number of Packets/SYN Packets transmitted within time period [Default Timespan = 5mins, Granularity = 5mins] | N/A | N/A |
Azure - LB - Bytes Count | Total number of Bytes transmitted within time period [Default Timespan = 5mins, Granularity = 5mins] | N/A | B |
Cloud - Azure - MySQL Server
add_circleService Check Name | Description | Default Thresholds (Warning, Critical) | UOM |
---|---|---|---|
Azure - MySQL - Active Connections | The average number of active connections [Default Timespan = 5mins, Granularity = 5mins] | N/A | N/A |
Azure - MySQL - CPU Percent | The CPU usage [Default Timespan = 5mins, Granularity = 5mins] | cpu_percent=70,90 | % |
Azure - MySQL - Connections Failed | The the number of failed connections [Default Timespan = 5mins, Granularity = 5mins] | N/A | N/A |
Azure - MySQL - Memory Percent | The memory usage [Default Timespan = 5mins, Granularity = 5mins] | memory_percent=70,90 | % |
Azure - MySQL - Storage Limit | The average storage limit [Default Timespan = 5mins, Granularity = 5mins] | N/A | B |
Azure - MySQL - Storage Percent | The storage usage [Default Timespan = 5mins, Granularity = 5mins] | storage_percent=70,90 | % |
Azure - MySQL - Storage Used | The storage usage in bytes [Default Timespan = 5mins, Granularity = 5mins] | N/A | B |
Azure - MySQL - IO Consumption Percent | The average IO consumption [Default Timespan = 5mins, Granularity = 5mins] | io_consumption_percent=70,90 | % |
Azure - MySQL - Server Log Storage Percent | The average server log storage usage percentage [Default Timespan = 5mins, Granularity = 5mins] | serverlog_storage_percent=70,90 | % |
Azure - MySQL - Server Log Storage Used | The average server log storage usage [Default Timespan = 5mins, Granularity = 5mins] | N/A | B |
Azure - MySQL - Server Log Storage Limit | The average server log storage limit [Default Timespan = 5mins, Granularity = 5mins] | N/A | B |
Azure - MySQL - Replication Lag | The average replication lag in seconds [Default Timespan = 5mins, Granularity = 5mins] | N/A | s |
Azure - MySQL - Backup Storage Used | The average backup storage usage [Default Timespan = 15mins, Granularity = 15mins] | N/A | B |
Azure - MySQL - Network Out | The number of bytes sent across active connections [Default Timespan = 5mins, Granularity = 5mins] | N/A | B |
Azure - MySQL - Network In | The number of bytes received across active connections [Default Timespan = 5mins, Granularity = 5mins] | N/A | B |
Cloud - Azure - Network Watcher - Connection Monitors
add_circleService Check Name | Description | Default Thresholds (Warning, Critical) | UOM |
---|---|---|---|
Azure - Network Watcher - Connection Monitors | If any Connection Monitors for the Network Watcher have a Monitoring Status of either 'Stopped' or 'NotStarted' then display them up to the display maximum [Default Timespan = 5mins, Granularity = 5mins] | N/A | NA |
Cloud - Azure - Network Watcher - VM Connectivity
add_circleService Check Name | Description | Default Thresholds (Warning, Critical) | UOM |
---|---|---|---|
Azure - Network Watcher - VM Connectivity | Check the status of TCP connection from a source VM to a target VM in Azure via a Network Watcher [Default Timespan = 5mins, Granularity = 5mins] | N/A | NA |
Cloud - Azure - Network Watcher - VM Security Rules
add_circleService Check Name | Description | Default Thresholds (Warning, Critical) | UOM |
---|---|---|---|
Azure - Network Watcher - VM Security Rules | Display the list of network security rules for a VM if there are fewer rules than the display maximum, otherwise display the number of rules. Returns a warning when the total rule count is NOT equal to the warning threshold [Default Timespan = 5mins, Granularity = 5mins] | N/A | NA |
Cloud - Azure - Network Watcher - VNG Troubleshooting
add_circleService Check Name | Description | Default Thresholds (Warning, Critical) | UOM |
---|---|---|---|
Azure - Network Watcher - VNG Troubleshooting | Check the status of the last troubleshooting results for a target resource [Default Timespan = 5mins, Granularity = 5mins] | N/A | NA |
Cloud - Azure - PostgreSQL server
add_circleService Check Name | Description | Default Thresholds (Warning, Critical) | UOM |
---|---|---|---|
Azure - PostgreSQL - Active Connections | The number of active connections currently connected to the database [Default Timespan = 5mins, Granularity = 5mins] | N/A | N/A |
Azure - PostgreSQL - CPU Percent | The CPU usage of the database server [Default Timespan = 5mins, Granularity = 5mins] | cpu_percent=70,90 | % |
Azure - PostgreSQL - IO Consumption Percent | The amount of I/O resources being consumed [Default Timespan = 5mins, Granularity = 5mins] | io_consumption_percent=70,90 | % |
Azure - PostgreSQL - Memory Percent | The current memory usage of the database [Default Timespan = 5mins, Granularity = 5mins] | memory_percent=70,90 | % |
Azure - PostgreSQL - Storage Limit | The limit of hard disk space the database has been allocated [Default Timespan = 5mins, Granularity = 5mins] | N/A | B |
Azure - PostgreSQL - Storage Percent | The hard disk usage of the database [Default Timespan = 5mins, Granularity = 5mins] | storage_percent=70,90 | % |
Azure - PostgreSQL - Storage Used | The hard disk storage currently used [Default Timespan = 5mins, Granularity = 5mins] | N/A | B |
Azure - PostgreSQL - Server Log Storage Percent | The average server log storage usage percentage [Default Timespan = 5mins, Granularity = 5mins] | serverlog_storage_percent=70,90 | % |
Azure - PostgreSQL - Server Log Storage Used | The average server log storage used [Default Timespan = 5mins, Granularity = 5mins] | N/A | B |
Azure - PostgreSQL - Server Log Storage Limit | The average server log storage limit [Default Timespan = 5mins, Granularity = 5mins] | N/A | B |
Azure - PostgreSQL - Network In | The number of bytes received across active connections [Default Timespan = 5mins, Granularity = 5mins] | N/A | B |
Azure - PostgreSQL - Network Out | The number of bytes sent across active connections [Default Timespan = 5mins, Granularity = 5mins] | N/A | B |
Azure - PostgreSQL - Backup Storage Used | The average backup storage used [Default Timespan = 30mins, Granularity = 30mins] | N/A | B |
Azure - PostgreSQL - Replica Lag Delay in Seconds | The maximum replica lag in seconds [Default Timespan = 5mins, Granularity = 5mins] | N/A | s |
Azure - PostgreSQL - Replica Lag Delay in Bytes | The maximum replica lag in bytes [Default Timespan = 5mins, Granularity = 5mins] | N/A | B |
Azure - PostgreSQL - Connections Failed | The number of failed connection attempts to the database [Default Timespan = 5mins, Granularity = 5mins] | N/A | N/A |
Cloud - Azure - Redis
add_circleService Check Name | Description | Default Thresholds (Warning, Critical) | UOM |
---|---|---|---|
Azure - Redis - Cache Bytes | The number of cache read and write bytes per second [Default Timespan = 5mins, Granularity = 5mins] | N/A | B/s |
Azure - Redis - Cache Requests | The number of cache hits and misses [Default Timespan = 5mins, Granularity = 5mins] | N/A | N/A |
Azure - Redis - Commands | The number of commands processed [Default Timespan = 5mins, Granularity = 5mins] | N/A | N/A |
Azure - Redis - Connected Clients | The maximum number of connected clients [Default Timespan = 5mins, Granularity = 5mins] | N/A | N/A |
Azure - Redis - CPU Usage | The CPU usage as a percentage [Default Timespan = 5mins, Granularity = 5mins] | percent_processor_time=70,90 | % |
Azure - Redis - Keys | The number of keys [Default Timespan = 5mins, Granularity = 5mins] | N/A | N/A |
Azure - Redis - Memory Usage | The memory usage as a percentage [Default Timespan = 5mins, Granularity = 5mins] | used_memory_percentage=70,90 | % |
Azure - Redis - Memory Used | The memory allocated to Redis (RSS) and used by Redis [Default Timespan = 5mins, Granularity = 5mins] | N/A | B |
Azure - Redis - Memory Used Ratio | The ratio of memory allocated to Redis to memory being used by Redis [Default Timespan = 5mins, Granularity = 5mins] | N/A | N/A |
Azure - Redis - Server Load | The maximum percentage load on the server [Default Timespan = 5mins, Granularity = 5mins] | server_load=70,90 | % |
Cloud - Azure - Site Recovery
add_circleService Check Name | Description | Default Thresholds (Warning, Critical) | UOM |
---|---|---|---|
Azure - Backup and Site Recovery - Recovery Events | The number and status of Azure Recovery Services Replication Events [Default Timespan = 5mins, Granularity = 5mins] | N/A | NA |
Azure - Backup and Site Recovery - Replicated Items | The number of items covered by Azure Recovery Vault Replication [Default Timespan = 5mins, Granularity = 5mins] | N/A | N/A |
Azure - Backup and Site Recovery - Recovery Jobs | The number and status of Azure Recovery Services Replication Jobs [Default Timespan = 5mins, Granularity = 5mins] | N/A | NA |
Azure - Backup and Site Recovery - Vault Health | The health status of an Azure Recovery Services Vault [Default Timespan = 5mins, Granularity = 5mins] | N/A | NA |
Cloud - Azure - SQL - DTU
add_circleService Check Name | Description | Default Thresholds (Warning, Critical) | UOM |
---|---|---|---|
Azure - SQL - DTU - Allocated Storage | The allocated data storage [Default Timespan = 5mins, Granularity = 5mins] | N/A | B |
Azure - SQL - DTU - Connections | The number of successful, failed and blocked connections [Default Timespan = 5mins, Granularity = 5mins] | N/A | N/A |
Azure - SQL - DTU - CPU Usage | The CPU usage of the database [Default Timespan = 5mins, Granularity = 5mins] | cpu_percent=70,90 | % |
Azure - SQL - DTU - Data IO Percent | The data IO percentage [Default Timespan = 5mins, Granularity = 5mins] | physical_data_read_percent=70,90 | % |
Azure - SQL - DTU - Deadlocks | The number of deadlocks [Default Timespan = 5mins, Granularity = 5mins] | N/A | N/A |
Azure - SQL - DTU - DTU Usage Percent | The DTU usage percentage [Default Timespan = 5mins, Granularity = 5mins] | dtu_consumption_percent=70,90 | % |
Azure - SQL - DTU - DTU Used | The DTU limit and number of DTUs used [Default Timespan = 5mins, Granularity = 5mins] | N/A | N/A |
Azure - SQL - DTU - Log IO Percent | The log IO percentage [Default Timespan = 5mins, Granularity = 5mins] | log_write_percent=70,90 | % |
Azure - SQL - DTU - Process CPU Usage | The CPU usage for the SQL Server process [Default Timespan = 5mins, Granularity = 5mins] | sqlserver_process_core_percent=70,90 | % |
Azure - SQL - DTU - Process Memory Usage | The memory usage for the SQL Server process [Default Timespan = 5mins, Granularity = 5mins] | sqlserver_process_memory_percent=70,90 | % |
Azure - SQL - DTU - Sessions Percent | The percentage of sessions [Default Timespan = 5mins, Granularity = 5mins] | sessions_percent=70,90 | % |
Azure - SQL - DTU - Storage Percent | The percentage of data space used and XTP (in-memory OLTP) storage used [Default Timespan = 5mins, Granularity = 5mins] | storage_percent=70,90 xtp_storage_percent=70,90 |
% |
Azure - SQL - DTU - Storage Used | The amount of data space used. [Default Timespan = 5mins, Granularity = 5mins] | N/A | B |
Azure - SQL - DTU - Tempdb Percent | The Tempdb log used percentage [Default Timespan = 5mins, Granularity = 5mins] | tempdb_log_used_percent=70,90 | % |
Azure - SQL - DTU - Tempdb Used | The Tempdb data size and log size [Default Timespan = 5mins, Granularity = 5mins] | N/A | B |
Azure - SQL - DTU - Workers Percent | The percentage of workers [Default Timespan = 5mins, Granularity = 5mins] | workers_percent=70,90 | % |
Cloud - Azure - SQL - DWU
add_circleService Check Name | Description | Default Thresholds (Warning, Critical) | UOM |
---|---|---|---|
Azure - SQL - DWU - Connections | The number of successful, failed and blocked connections [Default Timespan = 5mins, Granularity = 5mins] | N/A | N/A |
Azure - SQL - DWU - CPU Usage | The CPU usage of the data warehouse [Default Timespan = 5mins, Granularity = 5mins] | cpu_percent=70,90 | % |
Azure - SQL - DWU - Data IO Percent | The data IO percentage [Default Timespan = 5mins, Granularity = 5mins] | physical_data_read_percent=70,90 | % |
Azure - SQL - DWU - DWU Cache Percent | The cache hit and cache used percentage [Default Timespan = 5mins, Granularity = 5mins] | cache_hit_percent=70,90 cache_used_percent=70,90 |
% |
Azure - SQL - DWU - DWU Usage Percent | The DWU consumption usage of the data warehouse [Default Timespan = 5mins, Granularity = 5mins] | dwu_consumption_percent=70,90 | % |
Azure - SQL - DWU - DWU Used | The DWU limit and number of DWUs used [Default Timespan = 5mins, Granularity = 5mins] | N/A | N/A |
Azure - SQL - DWU - Local Tempdb Percent | The local Tempdb log used percentage [Default Timespan = 5mins, Granularity = 5mins] | local_tempdb_usage_percent=70,90 | % |
Azure - SQL - DWU - Memory Usage | The memory usage of the data warehouse [Default Timespan = 5mins, Granularity = 5mins] | memory_usage_percent=70,90 | % |
Cloud - Azure - SQL - Hyperscale
add_circleService Check Name | Description | Default Thresholds (Warning, Critical) | UOM |
---|---|---|---|
Azure - SQL - Hyperscale - Allocated Storage | The allocated data storage [Default Timespan = 5mins, Granularity = 5mins] | N/A | B |
Azure - SQL - Hyperscale - Connections | The number of successful, failed and blocked connections [Default Timespan = 5mins, Granularity = 5mins] | N/A | N/A |
Azure - SQL - Hyperscale - CPU Usage | The CPU usage of the database [Default Timespan = 5mins, Granularity = 5mins] | cpu_percent=70,90 | % |
Azure - SQL - Hyperscale - CPU Used | The CPU limit and number of CPUs used [Default Timespan = 60mins, Granularity = 60mins] | N/A | N/A |
Azure - SQL - Hyperscale - Data IO Percent | The data IO percentage [Default Timespan = 5mins, Granularity = 5mins] | physical_data_read_percent=70,90 | % |
Azure - SQL - Hyperscale - Deadlocks | The number of deadlocks [Default Timespan = 5mins, Granularity = 5mins] | N/A | N/A |
Azure - SQL - Hyperscale - Log IO Percent | The log IO percentage [Default Timespan = 5mins, Granularity = 5mins] | log_write_percent=70,90 | % |
Azure - SQL - Hyperscale - Process CPU Usage | The CPU usage for the SQL Server process [Default Timespan = 5mins, Granularity = 5mins] | sqlserver_process_core_percent=70,90 | % |
Azure - SQL - Hyperscale - Process Memory Usage | The memory usage for the SQL Server process [Default Timespan = 5mins, Granularity = 5mins] | sqlserver_process_memory_percent=70,90 | % |
Azure - SQL - Hyperscale - Sessions Percent | The percentage of sessions [Default Timespan = 5mins, Granularity = 5mins] | sessions_percent=70,90 | % |
Azure - SQL - Hyperscale - Tempdb Percent | The Tempdb log used percentage [Default Timespan = 5mins, Granularity = 5mins] | tempdb_log_used_percent=70,90 | % |
Azure - SQL - Hyperscale - Tempdb Used | The Tempdb data size and log size [Default Timespan = 5mins, Granularity = 5mins] | N/A | B |
Azure - SQL - Hyperscale - Workers Percent | The percentage of workers [Default Timespan = 5mins, Granularity = 5mins] | workers_percent=70,90 | % |
Azure - SQL - Hyperscale - XTP Storage Percent | The percentage of XTP (in-memory OLTP) storage used [Default Timespan = 5mins, Granularity = 5mins] | xtp_storage_percent=70,90 | % |
Cloud - Azure - SQL - Serverless
add_circleService Check Name | Description | Default Thresholds (Warning, Critical) | UOM |
---|---|---|---|
Azure - SQL - Serverless - Allocated Storage | The allocated data storage [Default Timespan = 5mins, Granularity = 5mins] | N/A | B |
Azure - SQL - Serverless - App CPU Billed | The billed app CPU usage [Default Timespan = 5mins, Granularity = 5mins] | N/A | N/A |
Azure - SQL - Serverless - App CPU Usage | The app CPU usage [Default Timespan = 5mins, Granularity = 5mins] | app_cpu_percent=70,90 | % |
Azure - SQL - Serverless - App Memory Usage | The app memory usage [Default Timespan = 5mins, Granularity = 5mins] | app_memory_percent=70,90 | % |
Azure - SQL - Serverless - Connections | The number of successful, failed and blocked connections [Default Timespan = 5mins, Granularity = 5mins] | N/A | N/A |
Azure - SQL - Serverless - CPU Usage | The CPU usage of the database [Default Timespan = 5mins, Granularity = 5mins] | cpu_percent=70,90 | % |
Azure - SQL - Serverless - CPU Used | The CPU limit and number of CPUs used [Default Timespan = 60mins, Granularity = 60mins] | N/A | N/A |
Azure - SQL - Serverless - Data IO Percent | The data IO percentage [Default Timespan = 5mins, Granularity = 5mins] | physical_data_read_percent=70,90 | % |
Azure - SQL - Serverless - Deadlocks | The number of deadlocks [Default Timespan = 5mins, Granularity = 5mins] | N/A | N/A |
Azure - SQL - Serverless - Log IO Percent | The log IO percentage [Default Timespan = 5mins, Granularity = 5mins] | log_write_percent=70,90 | % |
Azure - SQL - Serverless - Process CPU Usage | The CPU usage for the SQL Server process [Default Timespan = 5mins, Granularity = 5mins] | sqlserver_process_core_percent=70,90 | % |
Azure - SQL - Serverless - Process Memory Usage | The memory usage for the SQL Server process [Default Timespan = 5mins, Granularity = 5mins] | sqlserver_process_memory_percent=70,90 | % |
Azure - SQL - Serverless - Sessions Percent | The percentage of sessions [Default Timespan = 5mins, Granularity = 5mins] | sessions_percent=70,90 | % |
Azure - SQL - Serverless - Storage Percent | The percentage of data space used and XTP (in-memory OLTP) storage used [Default Timespan = 5mins, Granularity = 5mins] | storage_percent=70,90 xtp_storage_percent=70,90 |
% |
Azure - SQL - Serverless - Storage Used | The amount of data space used. [Default Timespan = 5mins, Granularity = 5mins] | N/A | B |
Azure - SQL - Serverless - Tempdb Percent | The Tempdb log used percentage [Default Timespan = 5mins, Granularity = 5mins] | tempdb_log_used_percent=70,90 | % |
Azure - SQL - Serverless - Tempdb Used | The Tempdb data size and log size [Default Timespan = 5mins, Granularity = 5mins] | N/A | B |
Azure - SQL - Serverless - Workers Percent | The percentage of workers [Default Timespan = 5mins, Granularity = 5mins] | workers_percent=70,90 | % |
Cloud - Azure - SQL - vCore
add_circleService Check Name | Description | Default Thresholds (Warning, Critical) | UOM |
---|---|---|---|
Azure - SQL - vCore - Allocated Storage | The allocated data storage [Default Timespan = 5mins, Granularity = 5mins] | N/A | B |
Azure - SQL - vCore - Connections | The number of successful, failed and blocked connections [Default Timespan = 5mins, Granularity = 5mins] | N/A | N/A |
Azure - SQL - vCore - CPU Usage | The CPU usage of the database [Default Timespan = 5mins, Granularity = 5mins] | cpu_percent=70,90 | % |
Azure - SQL - vCore - CPU Used | The CPU limit and number of CPUs used [Default Timespan = 60mins, Granularity = 60mins] | N/A | N/A |
Azure - SQL - vCore - Data IO Percent | The data IO percentage [Default Timespan = 5mins, Granularity = 5mins] | physical_data_read_percent=70,90 | % |
Azure - SQL - vCore - Deadlocks | The number of deadlocks [Default Timespan = 5mins, Granularity = 5mins] | N/A | N/A |
Azure - SQL - vCore - Log IO Percent | The log IO percentage [Default Timespan = 5mins, Granularity = 5mins] | log_write_percent=70,90 | % |
Azure - SQL - vCore - Process CPU Usage | The CPU usage for the SQL Server process [Default Timespan = 5mins, Granularity = 5mins] | sqlserver_process_core_percent=70,90 | % |
Azure - SQL - vCore - Process Memory Usage | The memory usage for the SQL Server process [Default Timespan = 5mins, Granularity = 5mins] | sqlserver_process_memory_percent=70,90 | % |
Azure - SQL - vCore - Sessions Percent | The percentage of sessions [Default Timespan = 5mins, Granularity = 5mins] | sessions_percent=70,90 | % |
Azure - SQL - vCore - Storage Percent | The percentage of data space used and XTP (in-memory OLTP) storage used [Default Timespan = 5mins, Granularity = 5mins] | storage_percent=70,90 xtp_storage_percent=70,90 |
% |
Azure - SQL - vCore - Storage Used | The amount of data space used. [Default Timespan = 5mins, Granularity = 5mins] | N/A | B |
Azure - SQL - vCore - Tempdb Percent | The Tempdb log used percentage [Default Timespan = 5mins, Granularity = 5mins] | tempdb_log_used_percent=70,90 | % |
Azure - SQL - vCore - Tempdb Used | The Tempdb data size and log size [Default Timespan = 5mins, Granularity = 5mins] | N/A | B |
Azure - SQL - vCore - Workers Percent | The percentage of workers [Default Timespan = 5mins, Granularity = 5mins] | workers_percent=70,90 | % |
Cloud - Azure - Storage Accounts
add_circleService Check Name | Description | Default Thresholds (Warning, Critical) | UOM |
---|---|---|---|
Azure - Storage Account - Capacity | The Account used capacity, in bytes [Default Timespan = 120mins, Granularity = 60mins] | N/A | B |
Azure - Storage Account - Availability | The percentage of availability for the storage service or the specified API operation [Default Timespan = 120mins, Granularity = 60mins] | availability=30:,10: | % |
Azure - Storage Account - Bytes | The amount of ingress/egress data, in bytes [Default Timespan = 120mins, Granularity = 60mins] | N/A | B |
Azure - Storage Account - Latency | The average latency/end-to-end latency used by Azure Storage to process a successsful request in milliseconds [Default Timespan = 120mins, Granularity = 60mins] | N/A | ms |
Azure - Storage Account - Blob Capacity | The amount of storage used by the storage account's Blob service in bytes [Default Timespan = 120mins, Granularity = 60mins] | N/A | B |
Azure - Storage Account - Blob Availability | The percentage of availability for the storage service or the specified API operation [Default Timespan = 1440mins, Granularity = 1440mins] | availability=30:,10: | % |
Azure - Storage Account - Blob Count | The number of Blob/containers in the storage account's Blob service [Default Timespan = 120mins, Granularity = 60mins] | N/A | N/A |
Azure - Storage Account - Blob Bytes | The amount of ingress/egress data, in bytes [Default Timespan = 1440mins, Granularity = 1440mins] | N/A | B |
Azure - Storage Account - Blob Latency | The average latency/end-to-end latency used by Azure Storage to process a successsful request in milliseconds [Default Timespan = 1440mins, Granularity = 1440mins] | N/A | ms |
Azure - Storage Account - Table Capacity | The amount of storage used by the storage account's Table service in bytes [Default Timespan = 120mins, Granularity = 60mins] | N/A | B |
Azure - Storage Account - Table Availability | The percentage of availability for the storage service or the specified API operation [Default Timespan = 120mins, Granularity = 60mins] | availability=30:,10: | % |
Azure - Storage Account - Table Count | The number of table/table entities in the storage account's Table service [Default Timespan = 120mins, Granularity = 60mins] | N/A | N/A |
Azure - Storage Account - Table Bytes | The amount of ingress/egress data, in bytes [Default Timespan = 120mins, Granularity = 60mins] | N/A | B |
Azure - Storage Account - Table Latency | The average latency/end-to-end latency used by Azure Storage to process a successsful request in milliseconds [Default Timespan = 120mins, Granularity = 60mins] | N/A | ms |
Azure - Storage Account - Queue Capacity | The amount of storage used by the storage account's Queue service in bytes [Default Timespan = 120mins, Granularity = 60mins] | N/A | B |
Azure - Storage Account - Queue Availability | The percentage of availability for the storage service or the specified API operation [Default Timespan = 120mins, Granularity = 60mins] | availability=30:,10: | % |
Azure - Storage Account - Queue Count | The number of queue/queue messages in the storage account's Queue service [Default Timespan = 120mins, Granularity = 60mins] | N/A | N/A |
Azure - Storage Account - Queue Bytes | The amount of ingress/egress data, in bytes [Default Timespan = 120mins, Granularity = 60mins] | N/A | B |
Azure - Storage Account - Queue Latency | The average latency/end-to-end latency used by Azure Storage to process a successsful request in milliseconds [Default Timespan = 120mins, Granularity = 60mins] | N/A | ms |
Azure - Storage Account - File Capacity | The amount of storage used by the storage account's File service in bytes [Default Timespan = 120mins, Granularity = 60mins] | N/A | B |
Azure - Storage Account - File Availability | The percentage of availability for the storage service or the specified API operation [Default Timespan = 1440mins, Granularity = 1440mins] | availability=30:,10: | % |
Azure - Storage Account - File Count | The number of file/file shares in the storage account's File service [Default Timespan = 120mins, Granularity = 60mins] | N/A | N/A |
Azure - Storage Account - File Bytes | The amount of ingress/egress data, in bytes [Default Timespan = 1440mins, Granularity = 1440mins] | N/A | B |
Azure - Storage Account - File Latency | The average latency/end-to-end latency used by Azure Storage to process a successsful request in milliseconds [Default Timespan = 1440mins, Granularity = 1440mins] | N/A | ms |
Cloud - Azure - Virtual Machines
add_circleService Check Name | Description | Default Thresholds (Warning, Critical) | UOM |
---|---|---|---|
Azure - VM - Bytes Read | The number of bytes read by the VM [Default Timespan = 5mins, Granularity = 5mins] | N/A | B |
Azure - VM - Bytes Written | The number of bytes written by the VM [Default Timespan = 5mins, Granularity = 5mins] | N/A | B |
Azure - VM - Bytes Read Operations | The number of bytes read operations by the VM per second [Default Timespan = 5mins, Granularity = 5mins] | N/A | per_second |
Azure - VM - Bytes Write Operations | The number of bytes write operations by the VM per second [Default Timespan = 5mins, Granularity = 5mins] | N/A | per_second |
Azure - VM - Network In | The number of bytes received by the VM [Default Timespan = 5mins, Granularity = 5mins] | N/A | B |
Azure - VM - Network Out | The number of bytes sent by the VM [Default Timespan = 5mins, Granularity = 5mins] | N/A | B |
Azure - VM - Percentage CPU | The percentage CPU usage [Default Timespan = 5mins, Granularity = 5mins] | percentage_cpu=70,90 | % |
Cloud - Azure - Virtual Machines Scale Sets
add_circleService Check Name | Description | Default Thresholds (Warning, Critical) | UOM |
---|---|---|---|
Azure - VMSS - Bytes Read | The number of bytes read by the VMSS [Default Timespan = 5mins, Granularity = 5mins] | N/A | B |
Azure - VMSS - Bytes Written | The number of bytes written by the VMSS [Default Timespan = 5mins, Granularity = 5mins] | N/A | B |
Azure - VMSS - Bytes Read Operations | The number of bytes read operations by the VMSS per second [Default Timespan = 5mins, Granularity = 5mins] | N/A | per_second |
Azure - VMSS - Bytes Write Operations | The number of bytes write operations by the VMSS per second [Default Timespan = 5mins, Granularity = 5mins] | N/A | per_second |
Azure - VMSS - Network In | The number of bytes received by the VMSS [Default Timespan = 5mins, Granularity = 5mins] | N/A | B |
Azure - VMSS - Network Out | The number of bytes sent by the VMSS [Default Timespan = 5mins, Granularity = 5mins] | N/A | B |
Azure - VMSS - Percentage CPU | The percentage CPU usage [Default Timespan = 5mins, Granularity = 5mins] | percentage_cpu=70,90 | % |
Cloud - Azure - Virtual Machines Scale Sets VM
add_circleService Check Name | Description | Default Thresholds (Warning, Critical) | UOM |
---|---|---|---|
Azure - VMSSVM - Bytes Read | The number of bytes read by the VMSSVM [Default Timespan = 5mins, Granularity = 5mins] | N/A | B |
Azure - VMSSVM - Bytes Written | The number of bytes written by the VMSSVM [Default Timespan = 5mins, Granularity = 5mins] | N/A | B |
Azure - VMSSVM - Bytes Read Operations | The number of bytes read operations by the VMSSVM per second [Default Timespan = 5mins, Granularity = 5mins] | N/A | per_second |
Azure - VMSSVM - Bytes Write Operations | The number of bytes write operations by the VMSSVM per second [Default Timespan = 5mins, Granularity = 5mins] | N/A | per_second |
Azure - VMSSVM - Network In | The number of bytes received by the VMSSVM [Default Timespan = 5mins, Granularity = 5mins] | N/A | B |
Azure - VMSSVM - Network Out | The number of bytes sent by the VMSSVM [Default Timespan = 5mins, Granularity = 5mins] | N/A | B |
Azure - VMSSVM - Percentage CPU | The percentage CPU usage [Default Timespan = 5mins, Granularity = 5mins] | percentage_cpu=70,90 | % |
Cloud - Azure - Virtual Network Gateways
add_circleService Check Name | Description | Default Thresholds (Warning, Critical) | UOM |
---|---|---|---|
Azure - Virtual Net Gateway - Tunnel Bandwidth | Average bandwidth of a tunnel in bytes per second [Default Timespan = 5mins, Granularity = 5mins] | N/A | B/s |
Azure - Virtual Net Gateway - Tunnel Bytes | Outgoing/Incoming bytes of a tunnel [Default Timespan = 5mins, Granularity = 5mins] | N/A | B |
Azure - Virtual Net Gateway - Tunnel Packets | Outgoing/Incoming packet count of a tunnel [Default Timespan = 5mins, Granularity = 5mins] | N/A | N/A |
Cloud - Azure - VM Backups
add_circleService Check Name | Description | Default Thresholds (Warning, Critical) | UOM |
---|---|---|---|
Azure - VM Backup - Backup Status | The backup status of a Virtual Machine in Azure [Default Timespan = 5mins, Granularity = 5mins] | N/A | NA |
Cloud - Azure - Windows VMs
add_circleService Check Name | Description | Default Thresholds (Warning, Critical) | UOM |
---|---|---|---|
Azure - Windows VM - Memory | The percentage of used memory and the available memory in bytes [Default Timespan = 5mins, Granularity = 5mins] | N/A | NA |
Azure - Windows VM - Processor Time | The percentage of processor time [Default Timespan = 5mins, Granularity = 5mins] | N/A | NA |
Azure - Windows VM - Processor Queue Length | The processor queue length [Default Timespan = 5mins, Granularity = 5mins] | N/A | NA |
Azure - Windows VM - Logical Disk Space | The percentage of free space and the amount of free space in bytes [Default Timespan = 5mins, Granularity = 5mins] | N/A | NA |
Azure - Windows VM - System Uptime | The system uptime [Default Timespan = 5mins, Granularity = 5mins] | N/A | NA |
Azure - Windows VM - Heartbeat | The time between the last two heartbeats [Default Timespan = 5mins, Granularity = 5mins] | N/A | NA |
Azure - Windows VM - Restarts | The number of restarts, and information on the user and comment history [Default Timespan = 1440mins, Granularity = 1440mins] | N/A | NA |
Azure - Windows VM - Shutdowns | The number of shutdowns, and information on the user and comment history [Default Timespan = 1440mins, Granularity = 1440mins] | N/A | NA |