What is IT Monitoring?
Overview
At Opsview, like in many other IT monitoring and Application Performance Management companies, we like to talk about the next generation of monitoring and the new features that are constantly being released and developed; from multi-tenancy and scalability through to service monitoring and dashboards, etc.
However, there is a lot of assumed knowledge that goes before each of the aforementioned items, for example the basics of what IT monitoring is and what the information provided by IT monitoring means to an organization.
The essence of IT monitoring is simple - ensure that your IT equipment is available and performing to the level expected and required to maintain your business.
In basic monitoring solutions this is often done by simply sending a ‘ping’ to the device and awaiting a response. If a response is obtained, then the user can be assured that the server or router or switch is ‘up’ and hasn’t been powered off or crashed etc. This function allows a system administrator a simple view into their IT estate, and to ensure that IT systems are available at the most basic level.
More advanced system monitoring solutions allow detailed views into the operational status of those devices, i.e.
“I know that my server is up and running, I also want to make sure that the hard drive doesn’t run out of space”. This is called a service check; checking that the hard drive is working, that the CPU isn’t 100% busy, etc. This leads us onto the hierarchical approach to monitoring.
Monitoring Philosophy: A Hierarchical Approach
Monitoring systems have a selection of objects that fit together. In order to monitor our server’s C:/ drive, we must first monitor our server. This is obvious. However sometimes the syntax and naming is very confusing, given that it often differs from vendor to vendor with some calling the server a “host” or a “monitor”, and some calling the C:/ drive style checks “monitors”, “service checks”, “counters”, etc. In the following paragraph, hopefully this syntax should become clearer as we step through each of the “3 layers”.
The Foundation Layer
The first of our 3 layers is “the foundation layer”. This layer of system monitoring forms the basis of the advanced monitoring discussed later. Here we monitor our physical or virtual devices, called ‘hosts’ such as a Windows server, Linux server, Cisco router, Nokia firewall or VMware virtual machine, etc. These are often the lowest level of the ‘stack’ and we ensure they are up by pinging them.
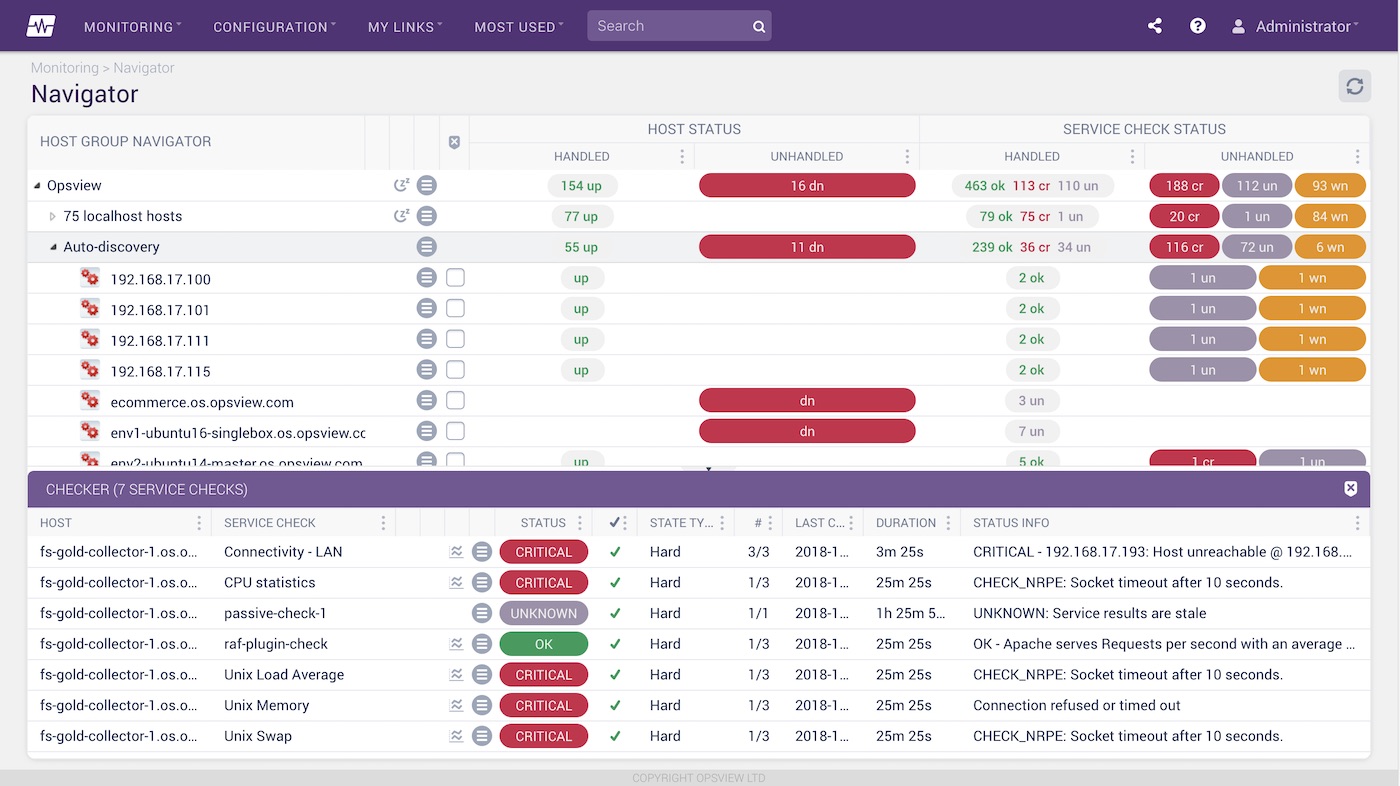
Once configured, this allows us a view such as the image shown (below) of the hosts we have added and which ones are up or down.
The IT Monitoring Layer
Once we know the physical or virtual host is up, we want to monitor items running on them. These could be:
- Linux servers: Swap space, CPU Usage, FS usage, Service running, etc.
- Windows servers: Pagefile size, memory usage, CPU Usage, C:/ space, processes, etc. c. Network devices: throughput on interfaces, CPU load, memory, etc.
- VMware/Virtualization: Datastore free, temperature checks, number of VM’s, CPU, etc.
We refer to these items as service checks and they run against the hosts that we configured and specified in the foundation layer.
A common scenario is:
“I’ve added my Windows Server, ‘windows001.domain.com’, as a host and I can see that it is up (step 1). Now I want to monitor some items on it, so I’ll add a ‘C:/ Drive’ check, a ‘CPU Check’, and a ‘Memory Check’, along with a few others. Now I can not only see that my host is up, but I’m also monitoring performance items on that server, giving me a better view into its operational performance”.
This gives a good insight into server health and performance. However, the issue we have now is that to add 100 hosts (e.g. Windows servers) and then 6 service checks to each of those hosts, could take a long time. So in Opsview and a few other monitoring solutions, we have the concept of grouping these service checks together into a Host template. We give a group a meaningful name i.e. “Windows Servers”, to which we can add lots of service checks. This template can then be applied en-masse to all the Windows servers, reducing the time it takes to implement all our checks.
Now we have templates to speed up our configuration time, our only time consuming task is adding these hosts “hostname by hostname”. Again, innovation in monitoring has deemed this an unnecessary evil – with the creation of ‘Autodiscovery’.
Autodiscovery allows a monitoring system to “search” and scan a predefined subnet or network and find devices on that network. In our Windows example, we can scan the subnet and discover all hosts on that network and import them into our monitoring system, ready to be modified and have host templates added to.
In Opsview, we can even determine the Operating System and apply templates automatically based on the results, meaning the time-to-value is extremely low.

The Interpretation Layer
Now that we are monitoring our hosts and also the services running on them, we can start to be intelligent with the interpretation of the data. i.e. “how do we present this so that we can clearly see that a problem is occurring?”
Commonly in IT, servers and network devices make up larger objects such as applications, websites, services, etc. and these are the items we actually want to monitor, rather than the actual items which they consist of. Ultimately the failure of an IT system is what will impact our business and our customers, so prevention of these problems is the goal for the monitoring.
Example: I run an e-commerce website and I want to know when this website is impacted by IT issues and what part of this website is impacted. We know that this website is made up of a few Apache servers, running on 2 Linux servers, connected to the internet via a router and a switch, and also relying on a DNS server.
In the “monitoring layer” outlined in the previous section, we are using service checks to monitor performance metrics for each of these areas individually, i.e:
- Apache: number of requests per second, number of apache processes, etc.
- Linux servers: CPU usage, memory usage, hard disk drive space, temperature, etc.
- Switch/Router: CPU load, RAM usage, interface throughput, packets per second, etc.
- DNS Server: DNS service running, performance counters, queues, etc.
This gives us a great view into how each of these individual components are doing. What we want now is to look at it holistically; for example as a website rather than a series of objects. To do this, Monitoring software vendors have created “business service monitoring”.
Business service monitoring allows users a view into the performance of their applications, stacks, websites etc, rather than having to look at all the individual components and work it out for themselves. This is what takes an average monitoring tool to the next level in the way that it deals with services and “top down views”, compared to bottom-up views i.e. focusing on business services rather than components within the service.
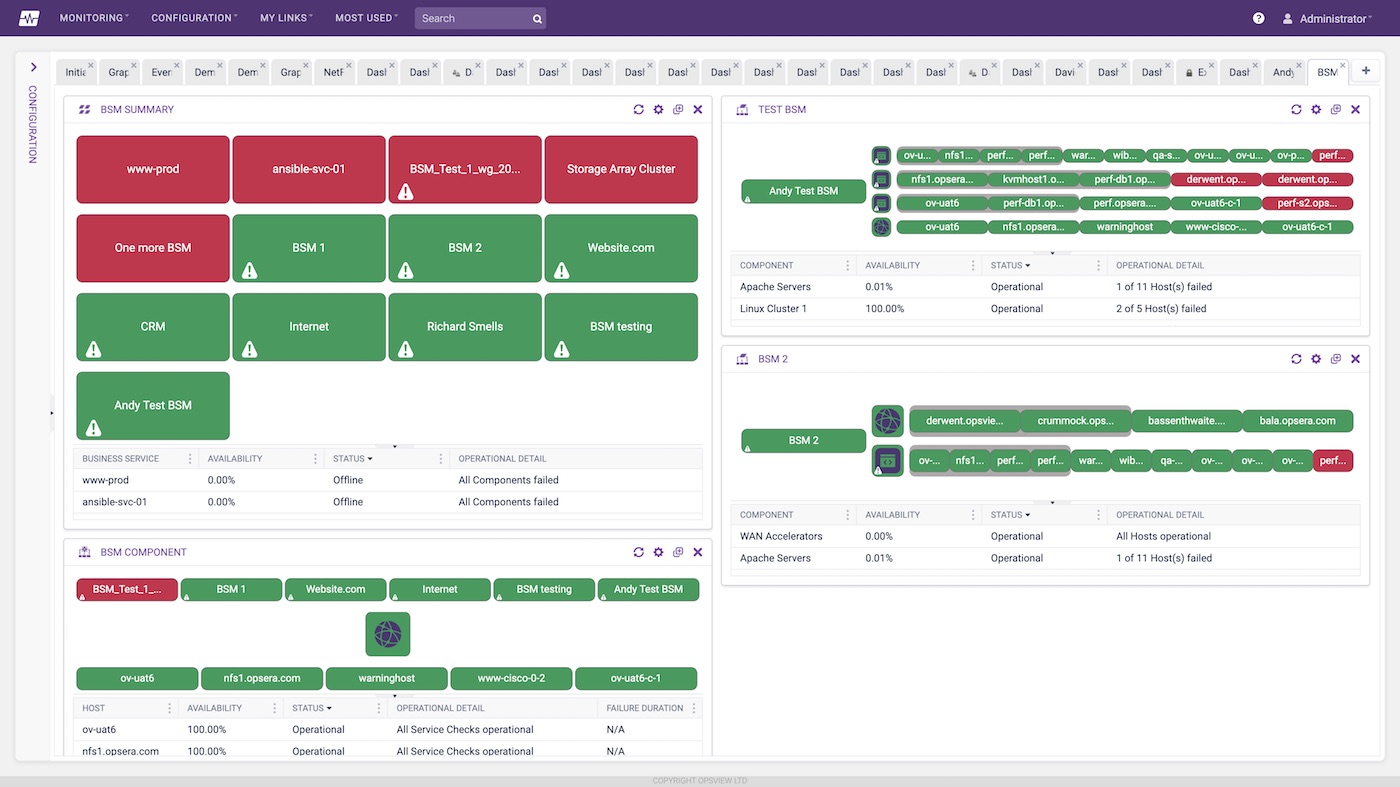
In Opsview, we have the concept of “Hashtags”. These allow users to take individual service checks from individual hosts and group them together logically in a way that is easy to understand, for example “My Website”. From here we can create a traffic light view into our services – as demonstrated in the following example.

Once we have configured our Hashtags, not only can we monitor based upon them – i.e. using the above view to see the actual “health” of my Email Service or accounting application, but I can use this Hashtag in my events console to show only events relating to my email service related hardware:
This allows me to see all the events that have happened on any piece of hardware (server through to the switches), that have an effect on the performance of my website, service, customer, etc.
In Opsview these hashtags can then also be used in our reports module, to show the historical health of the various monitored services in a number of formats; business reports such as SLA reports or cost of downtime reports, through to technical reports such as performance reports, availability reports, etc.
These reports can also be automated and delivered regularly (daily, weekly, monthly etc) so that you can easily see the performance or availability or cost of downtime for any pre-defined keyword.
Conclusion
Although the task of monitoring whether a host is up or down may seem relatively simple, the potential consequences of the outcome of this check can be huge for an organization reliant on IT systems. The intention of this article was to demonstrate how IT system monitoring functions from a tiered approach, from simple monitoring of whether a host is responsive, through to using business service monitoring (BSM) to view the health of services, the cost of a service being down and to see how business service availability may impact an organization.
