Part one of a series objectively examining important topics in contemporary data center monitoring, including observability, automation, and cost...
You are here
How to Use Automation in IT Monitoring
Overview
In this technical overview we will look at automation and monitoring, and how they can be deployed to work hand-in-hand to ensure that when a problem does occur, that its impact is as small as possible.
Automation is defined differently depending on where you look and is highly context dependent. A generally accepted definition is that "Automation is the use of machines, control systems and information technologies to optimize productivity in the production of goods and delivery of services."
In a monitoring context, automation allows our monitoring tool to react based upon a series of criteria being met. In other words, when something goes wrong, the system has the power to automatically fix it (proactive monitoring) or automatically alert someone (notifications) or even automatically create a ticket in a service desk and assign it to a queue (service desk connectors).
These are all what we would term "problem automation" – event driven items which are engaged when something happens, i.e. "The DHCP service on WINSRV003 has stopped” will result in an SMS/Email/Push notification to our mobile device, an automatic service desk ticket, or an event handler proactively restarting the service – if we so choose.
The other side of the coin is automation that occurs without any event occurring, “operational automation”. This contains items such as deployment tool integration, i.e. “when I deploy a new host via puppet, automatically add this to my monitoring tool so that it is monitored" (Removing the necessity to manually add it).
We can also schedule reports to be automatically sent at certain times / dates and stop on certain dates (maybe customer renewal dates), meaning we get the data in our inbox each morning without any human intervention. We can also have our monitoring solution automatically take backups of our network configurations from our devices such as our Cisco routers, so that if the unthinkable happens and the router is stolen or destroyed, a fresh copy of the configuration can be pulled from the monitoring system, added to new hardware, and the site will be back up.
Problem Automation
In this section on problem automation we will take a detailed look at alerting / service desk integration and pro-active monitoring.
Alerting
When a problem occurs on your monitored equipment, you will want to know about it as soon as possible just in case you are not watching the display when the event happens, or it is 2AM and you are the stand-by engineer.
This is where notifications come into their own. Most modern APM / IT monitoring systems allow users to setup alerts so that when a problem occurs they get an email alerting them of an issue occurring. The more advanced solutions allow users to choose from multiple methods, along with specifics on which hosts to be alerted for, which services on those hosts, etc.
In Opsview, we have the concept of “notification profiles” which allow users to choose specifically how, when and what alerts they get receive, as below:
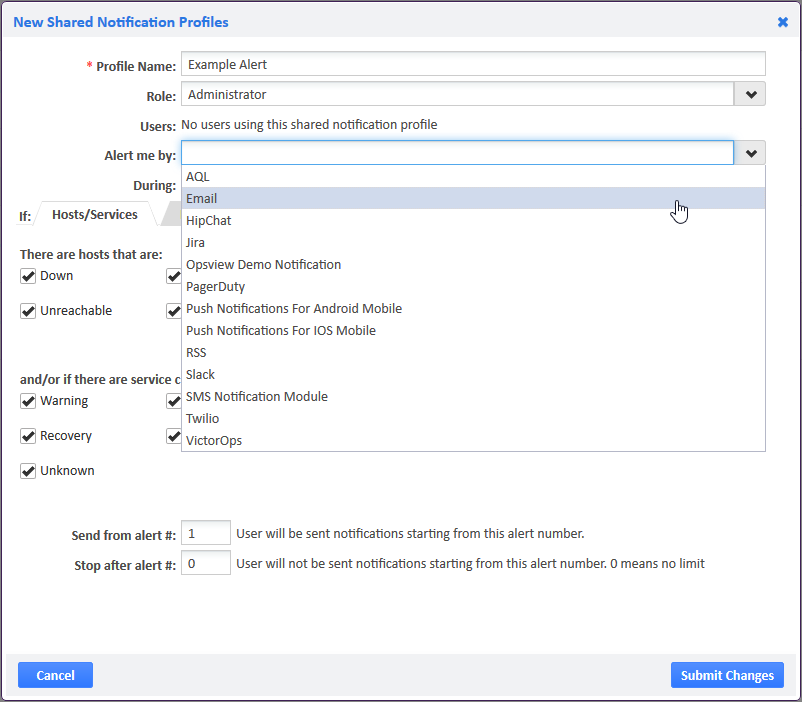
In the example we are choosing to be notified only about network devices that are down or unreachable, or service checks on those hosts that are critical, only during “non work hours”, and to be alerted by Email/SMS and Push notifications.
This automation allows administrators to be informed immediately for only the problems they want to be aware of, instead of the dreaded “notification spam” whereby they get alerted for every change in state. This alert refinement, along with the ability to choose when and what for, and to have the option to get the notifications via a multitude of methods, allows administrators to be aware immediately of problems, so that they can fix them faster.
Service Desks
The next stage of automation is service desk integration. Some of the higher-end APM / IT monitoring solutions can integrate with your service desk using API’s, in order to automatically create tickets when they occur.
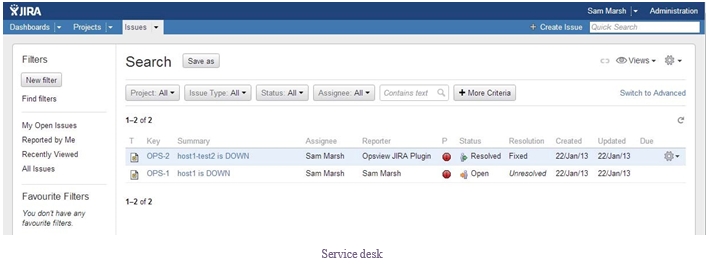
This removes the cumbersome need for an administrator having to view the problem, login to the service desk, raise a ticket, and then add that ticket number against the original issue. With service desk automation, in the event of an error occurring, Opsview will automatically create the ticket for you in the service desk group / project desired (depending on CRM/Service desk), and then take the ticket number and add it as a comment next to the original error within Opsview. This allows subsequent administrators to log-in and see what the issue is, and what the ticket number is, in order to prevent duplication of tickets, etc.
This service desk automation allows administrators to keep an eye on the ticket queue specific to the monitoring system, i.e. the Opsview Monitor queue, and work tickets raised based upon the criteria given during setup (we may not want to raise tickets for simple errors / common errors such as high Pagefile use, swap, etc).
Pro-active Monitoring
One of the benefits of automation and monitoring systems is to have the monitoring solution actually solve the problem for you, leaving you to spend time figuring out why it failed, rather than actually fixing it.
By using event handlers, we can specify what a service should automatically do when the service check turns critical, from nothing (default) but alerting, through to automatically restarting the service, etc via scripts, meaning it can do pretty much anything imaginable (at least anything you can script!).
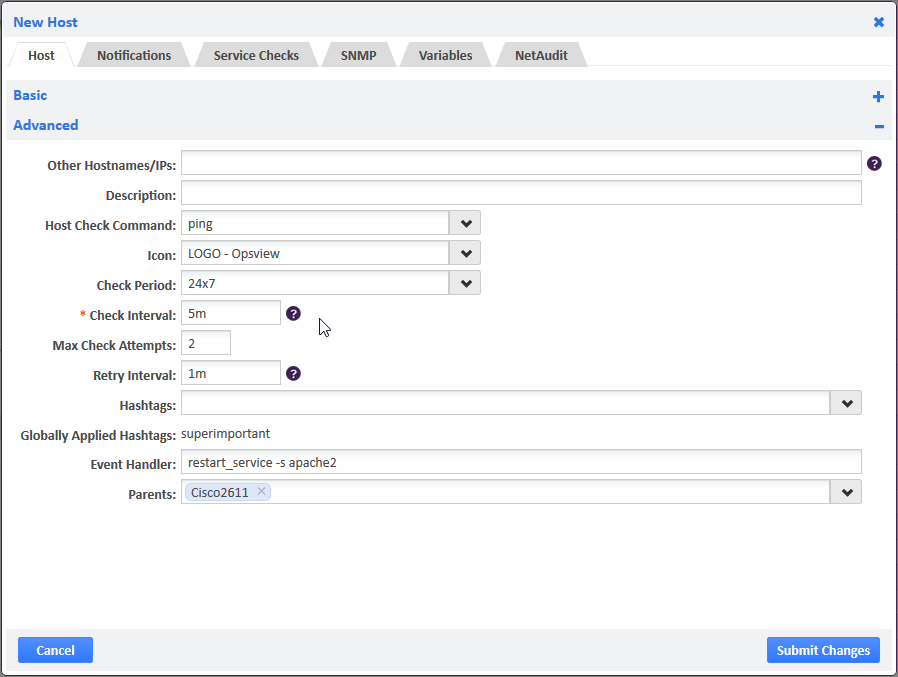
In the above example, we are monitoring a service and specifying that when it goes critical, to run the event handler “restart_service –s apache2”, which will simply re-start the apache service.
These scripts are executed by Nagios Remote Plugin Executor (NRPE), or its Windows version “NS Client++” and allow you a vast range of possibilities, i.e. you may be monitoring the temperature of a server, and when that service check goes critical you call a script that automatically ramps up the fans for 20 minutes (hardware dependent, naturally).
Operational Automation
The flip side of proactive automation is operational automation which is automation that will occur without the context of problems, errors, etc.
As outlined earlier, examples of "operational automation" are numerous – however in this article we will cover:
- Deployment
- Reporting
- Network backup and auditing
Deployment
Nearly all of the high-end APM/IT monitoring solutions have deployment assistance; the more cloud focused amongst the market place have "cloud agents" or an agent-register technology, which will be configured with the details of the monitoring server, and automatically register itself when it comes online, and de-register itself when it goes offline. This is a great idea for the cloud/dynamic environments such as those for developers, QA teams, etc.
On the other side we have the deployment tool integration with tools like Red Hat Satellite, OpenStack, Puppet or chef to reduce operational overheads, in terms of time taken to register the newly deployed server or virtual machine into your monitoring solution.
In Opsview, we have integration with Puppet and Chef so that when an administrator deploys a new server or VM, it automatically registers itself into the Opsview system saving hours of potential time wasted over the year:
Reporting
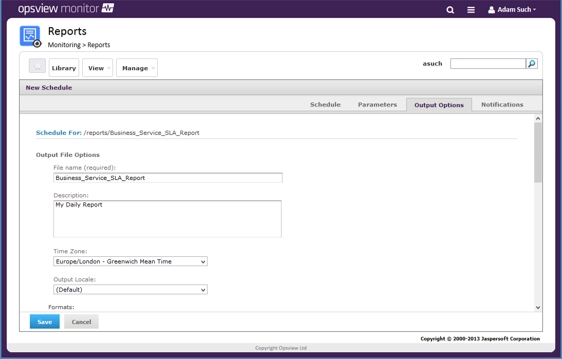
The second item in operational automation is reporting. Rather than having to log-in and run the report, or have an administrator do it and send it to a distribution list, most APM / IT monitoring tools with good reporting capability will allow you to automate the creation and sending of reports.
This means that your "Daily SLA Report" will be in your inbox at 8:30AM Monday – Friday without user involvement, removing the human element of either forgetting to run the report, or absence from work meaning it doesn't get run, etc.
In Opsview, users can automate any report with the GUI using the pre-defined report formats from "Daily SLA Report" to "Yearly cost of downtime", and use the highly configurable GUI to specify when the report is sent, what it is generated against, to whom it is sent to, in which format, and at what time/date/timezone.
Network Backup & Auditing
The final part of operational automation is network backup and auditing. Imagine the scenario, we have a Cisco 6509, running one supervisor, with 1000 lines of IOS configuration on it, and a fire breaks out destroying the chassis. Getting replacement hardware onsite can be done in 4 hours on the right Cisco SLA/Contract, however if you do not have a backup of that configuration, it is going to take a very long time to recreate.
Using a networking auditing tool, this risk can be removed. In the high-end monitoring tools, the option to not only monitor a network device, but take a copy of its configuration and alert on changes, allows network administrators peace of mind and a view not just into the performance of the router or switch, but also a view into the actual configuration.
In Opsview, we have a module called "Net Audit", which is enabled on network devices by an administrator wishing to monitor its configuration and view it from a central console as below:
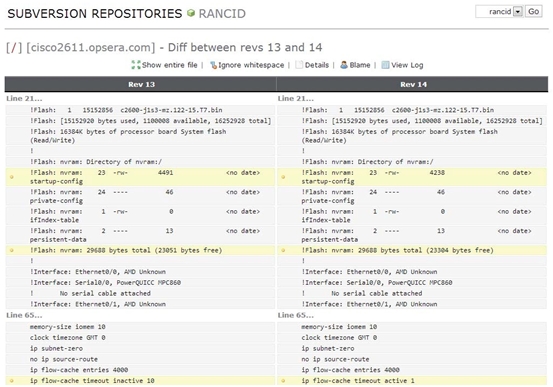
This allows us to view any changes in the configuration, and get alerted if anything changes due to malicious attacks, etc.
Conclusion
Automation is a key factor in IT monitoring; without it unnecessary duplication of tasks and human intervention would be required, hampering IT support and operations teams worldwide. The more advanced the monitoring tool, the more automation it should provide. However is there a tipping point when there is too much automation present where human intervention is actually preferable? In the blog Application Performance Monitoring Tools, we look at innovation in IT and APM/Monitoring, and question whether a fully automated/closed IT ecosystem is a possibility, and if it is – is it something we want?
Done right, IT monitoring provides clarity and promotes operational effectiveness. Done wrong, it can make your staff crazy and limit business...
DevOps is about accelerating delivery of new products and services at scale, reliably and affordably. Doing this requires comprehensive IT ...


